Hold down the T key for 3 seconds to activate the audio accessibility mode, at which point you can click the K key to pause and resume audio. Useful for the Check Your Understanding and See Answers.
Lesson 4: Periodic Trends
Part d: Electronegativity
Part 4a:
The Periodic Law Revisited
Part 4b:
Atomic Size
Part 4c:
Ionization Energy
Part 4d: Electronegativity
What is Electronegativity?
The valence shell electrons of an atom are involved in the bonds that are formed between atoms of that element. As we will discuss in great detail in Chapter 6 of this Chemistry Tutorial, bonds are formed between atoms as the result of the transfer of electrons or the sharing of electrons. The tendency of two atoms to participate in either electron transfer or electron sharing is determined by their so-called electronegativity value.
Electronegativity is a periodic property. It is defined as a measure of the tendency of an atom to attract shared electrons towards itself. An electron-greedy element will have a relatively high electronegativity value and exert a strong attractive pull upon the electrons it shares with other elements. Electronegativity values range from 0.7 on the low end to 4.0 on the high end. Electronegativity is not a measured value and thus has no unit. It is a rating given to every element based upon a theoretical scale. The most popular scale used to rate an element’s electronegativity is the Pauling Scale. Linus Pauling based his ratings on comparisons of the amount of energy stored in the bonds formed between various elements. Since noble gases seldom form bonds with other elements, there are no electronegativity values assigned to them.
A Look at the Data
The chart below displays electronegativity values as a function of atomic number for periods 2-6 of the periodic table. Electronegativity values for the transition metals and lanthanides have been omitted.
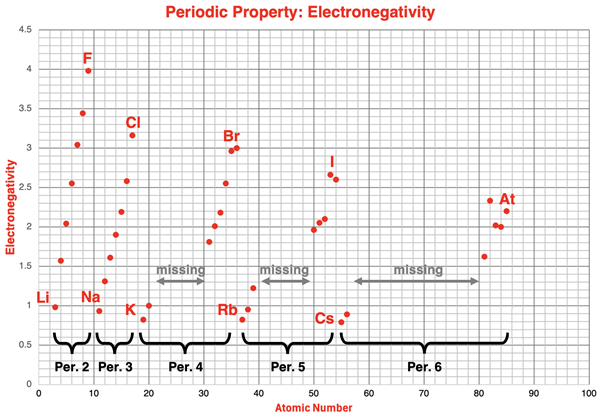
The alkali metals and the halogen data points have been labeled on the chart. The pattern of change or trend from Li to F (period 2), from Na to Cl (period 3), from K to Br (period 4), from Rb to I (period 5), and from Cs to At (period 6) is clearly evident. The pattern of an increasing electronegativity value with increasing atomic number repeats itself during each of these periods.
The Data in Table Format
The periodic table below presents another view of the data. The number in each cell is the electronegativity value for that element. The noble gas column has been removed.
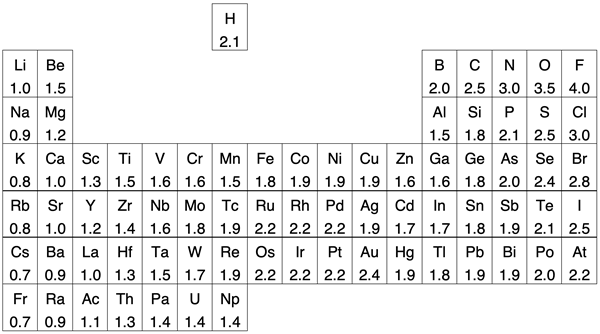
Like the graph above, the periodic table shows clear trends for the main group elements. The trends are evident for across each period and down each group. The transition metals do not show any immediately obvious trend and are a bit of a departure from the trends observed for main group elements.
Hydrogen has been moved out of its usual group 1 location above lithium. Like all group 1 elements, hydrogen has an s1 electron configuration. It also forms a 1+ ion. Many of hydrogen’s other properties make it quite different than the other group 1 metals. When it comes to electronegativity and the tendency to attract electrons in bonds, it might fit better somewhere above boron and carbon … or left on its own island as shown.
Describing the Trends
Two trends for main group elements can be identified in the above data.
- As one proceeds from left to right across a row of the Periodic Table, the electronegativity increases.
- As one proceeds from top to bottom down a column of the Periodic Table, the electronegativity decreases.
More to Come
We will return to the topic of electronegativity in
our next chapter on the topic of chemical bonding. The type of bonds formed between atoms of different elements can be predicted using electronegativity values.
Before You Leave
- Practice. Try our Periodic Trends Concept Builder. It’s great practice! The first of three activities pertains to atomic radius.
- Download our Study Card on Periodic Trends. Save it to a safe location and use it as a review tool. This Study Card covers Lesson 4b – Lesson 4d.
- The Check Your Understanding section below include questions with answers and explanations. It provides a great chance to self-assess your understanding.
Check Your Understanding
Use the following questions to assess your understanding. Tap the
Check Answer buttons when ready.
1. For each set of three elements, use the periodic trends to rank the elements in order of increasing atomic size:
- 3Li, 11Na, 55Cs
- 20Ca, 31Ga, 35Br
- 6C, 32Ge, 82Pb
- 7N, 37Rb, 51Sb
- 17Cl, 34Se, 35Br
2. In general, in which area of the periodic table would you be more likely to find elements with the highest electronegativity values?
- Top left
- Top right
- Bottom left
- Bottom right
3. In general, in which area of the periodic table would you be more likely to find elements with the lowest electronegativity values?
- Top left
- Top right
- Bottom left
- Bottom right
4. As mentioned, electronegativity is a measure of the amount of attraction that an element has for the electrons that it shares in bonds with other elements. The greater the electronegativity value, the greedier an element is for electrons. For the following pairs of elements, identify the one that would grab the
lion’s share of those shared electrons.
- 9F vs. 53I
- 19K vs. 34Se
- 6O vs. 56Ba
- 7N vs. 12Mg