Getting your Trinity Audio player ready...

Hold down the T key for 3 seconds to activate the audio accessibility mode, at which point you can click the K key to pause and resume audio. Useful for the Check Your Understanding and See Answers.

Experiments are commonly performed in order to determine the effect of one variable (the independent variable) upon another variable (the dependent variable).  Once the data have been collected, it is a standard procedure to represent the data in an x-y plot. The dependent variable values are plotted along the y-axis and the independent variable values are plotted along the x-axis.
 

There are several versions of this question that differ only in terms of the randomized order of the answer options. Here is one of those versions:
 

Version 1:

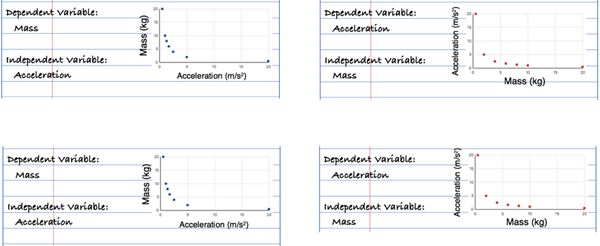
Anna Litical and Nellie Newton conduct several trials in which they study the effect of varying the mass of a cart upon the acceleration of the cart when pulled with a constant force. Which notebook entry accurately identifies the variables and displays the best choice for a plot?


In an experiment that studies the effect of "X" upon "Y", the experimenter systematically alters the value of X. This X-quantity is referred to as the independent variable. The experimenter then measures the value of the Y-quantity that results from this change in the X-quantity. This Y-quantity is referred to as the dependent variable because its value is dependent upon the changes that are made to X.

Data collected in an experiment like this are often plotted. When they are, the Y-quantity values are plotted along the vertical  (y) axis and the X-quantity is plotted along the horizontal (x) axis. So check each answer option for two things: that the independent and dependent variables are correctly identified; and that they are plotted along the proper axis.

Sorry.  We're pedaling as fast as we can but as of this writing we do not have any Tutorial information on the topic of experimentation and variables. 


Tired of Ads?
Go ad-free for 1 year