There are five representations. You must choose which one is NOT consistent with the others. Here's information about each representation:
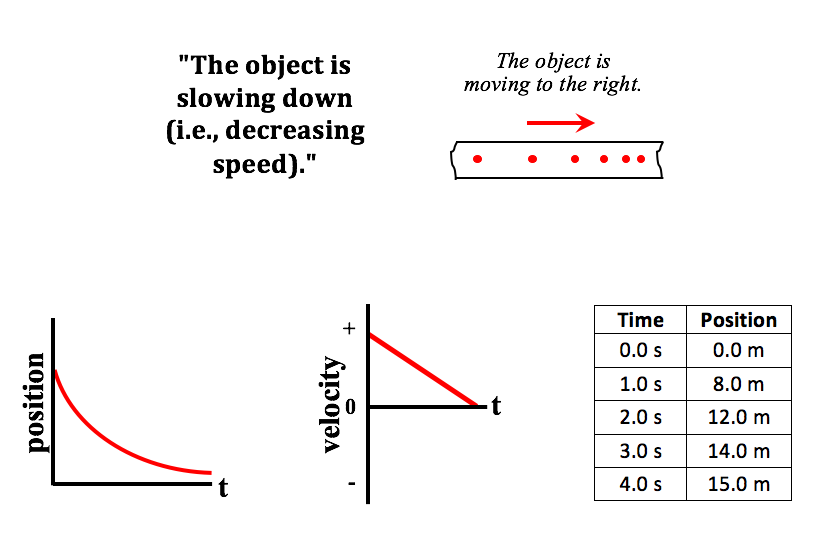
Position-Time Graphs: A curved line on a position-time graph is an indicator of a changing velocity motion. If the line slopes upward, then the velocity is positive (rightward); if the line slopes downward, then the velocity is negative (leftward). If the line is getting steeper over the course of time, then the object is speeding up. If the line is becoming less steep (i.e., flatter) over the course of time, then the object is slowing down. A constant velocity motion would be represented by a straight, diagonal line.
Velocity-Time Graphs: A diagonal line on a velocity-time graph is an indication of a changing velocity motion. Lines that are heading away from the time axis represent speeding up motions. And lines that are approaching the time axis represent slowing down motions. A line in the + region of the v-t graph is an indication that the object is moving in the positive (rightward) direction. And a line in the - region of the v-t graph is an indication that the object is moving in the negative (leftward) direction. A constant speed motion would be represented by a horizontal line.
Dot Diagrams: Dot diagrams indicate how the position of the object is changing with time. If the spacing between dots increases over the course of time, then the object is speeding up. If the spacing decreases over the course of time (i.e., the dots get closer and closer to one another), then the object is slowing down. The arrow on the diagram will indicate whether the velocity is rightward (positive) or leftward (negative). Constant speed motions would be represented by equal spacing between dots.
Position-Time Tables: Start at a time of 0.0 seconds and scan down the position column observing how the position changes over the course of time. Is the change in position from one row to the next a constant change value? Or is the amount of change becoming smaller or greater? A constant change in position is an indicator of a constant speed. An increasing change is an indication of a speeding up motion. And a decreasing amount of change is an indication of a slowing down motion.
Verbal Descriptions: Check to see if the verbal descriptions mathes one or more of the other representations. It is often easiest to "translate" the graphs, the diagram, and the table into words and then check to see if the translation matches the provided verbal description.