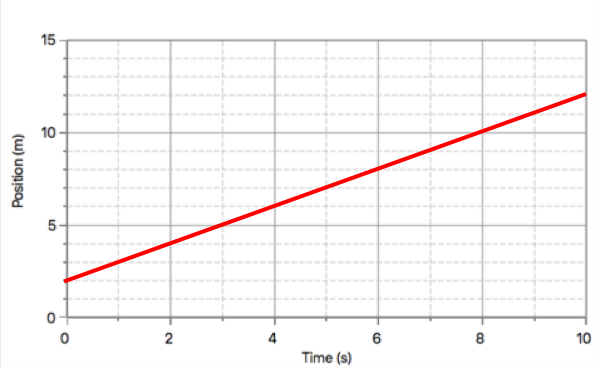
The slope of the line on a position-time graph is the velocity. This question will involve calculating the slope and then using its meaning to predict the time it takes for the object to reach a position that lies outside the range of the graph. This prediction part of the problem is sometimes referred to as extrapolation.
To calculate slope, you will need to determine the "x, y" coordinates of two points on the line. Pick points for which you are certain of what the coordinates are. The first point (at t = 0 s) and the last point on the graph would be great choices. Once you've selected the two points and determined their coordinates, calculate the ratio of the y-coordinate difference divided by the x-coordinate difference. That is, determine the ratio of ∆position to ∆time.
The above procedure is sometimescalled the rise per run method. That is what slope means - by how much does the line rise upward for every 1 unit of run across the horizontal axis. If you determine a slope of the line to be 2.0 m/s, then you have determined that for every 1 second of motion, the object changes its position by 2.0 meters. It is this meaning that you must use to predict the time that the object will be at the specified position.
Suppose that the line on the graph ends at a position of 12.0 m at 10.0 seconds. And suppose that you wish to predict the time that the object will be at 18.0 m. This position is 6.0 m beyond the last position on the graph. If moving at 2.0 meters for every 1.0 second of time, it will take 3.0 additional seconds to cover this additional 6.0 meters. This extra time must be added onto the last time on the graph. By so doing, you will be predicting the time that the object will be at that specified position.
