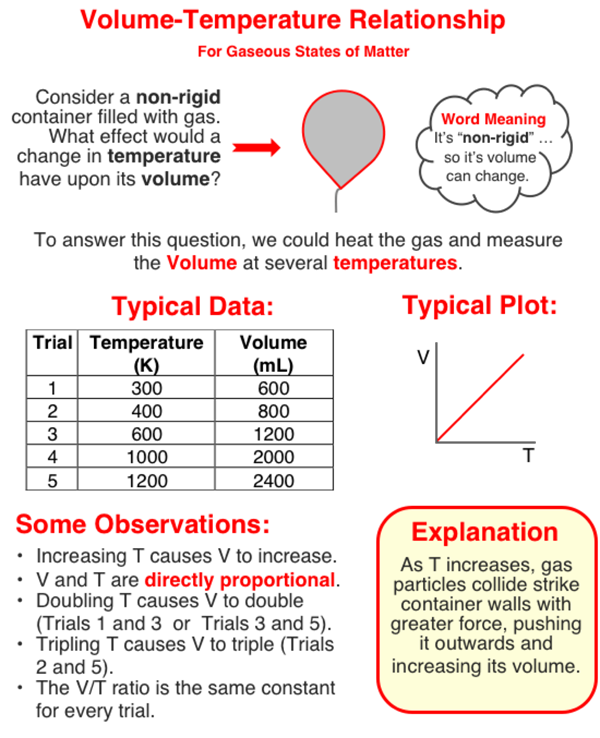
The volume of a sample of gas is dependent upon the Kelvin temperature of the gas. Increasing the Kelvin temperature increases the volume. The two quantities are directly proportional to one another.
Getting your Trinity Audio player ready...
Hold down the T key for 3 seconds to activate the audio accessibility mode, at which point you can click the K key to pause and resume audio. Useful for the Check Your Understanding and See Answers.
Volume and Temperature - help2
There are three questions in this Question Group. Each question is very similar to one another. The question below is one of the questions.
Version 1:
Which plot best represents the relationship between the volume and the temperature of a sample of gas? (Assume a constant pressure and number of particles.)
