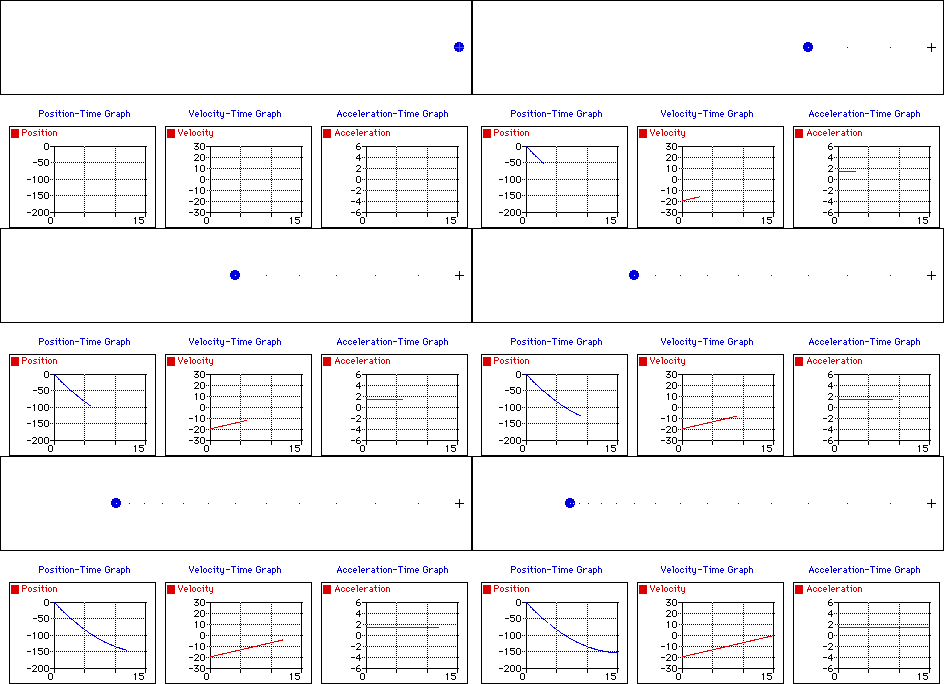
Negative Velocity and Positive Acceleration
Observe that the object below moves in the negative direction with a changing velocity. An object which moves in the negative direction has a negative velocity. If the object is slowing down then its acceleration vector is directed in the opposite direction as its motion (in this case, a positive acceleration). The dot diagram shows that each consecutive dot is not the same distance apart (i.e., a changing velocity). The position-time graph shows that the slope is changing (meaning a changing velocity) and negative (meaning a negative velocity). The velocity-time graph shows a line with a positive (upward) slope (meaning that there is a positive acceleration); the line is located in the negative region of the graph (corresponding to a negative velocity). The acceleration-time graph shows a horizontal line in the positive region of the graph (meaning a positive acceleration).

For more information on physical descriptions of motion, visit The Physics Classroom Tutorial. Detailed information is available there on the following topics:
Ticker Tape Diagrams
Meaning of Acceleration
Position-Time Graphs
Velocity-Time Graphs