The Passing Lane
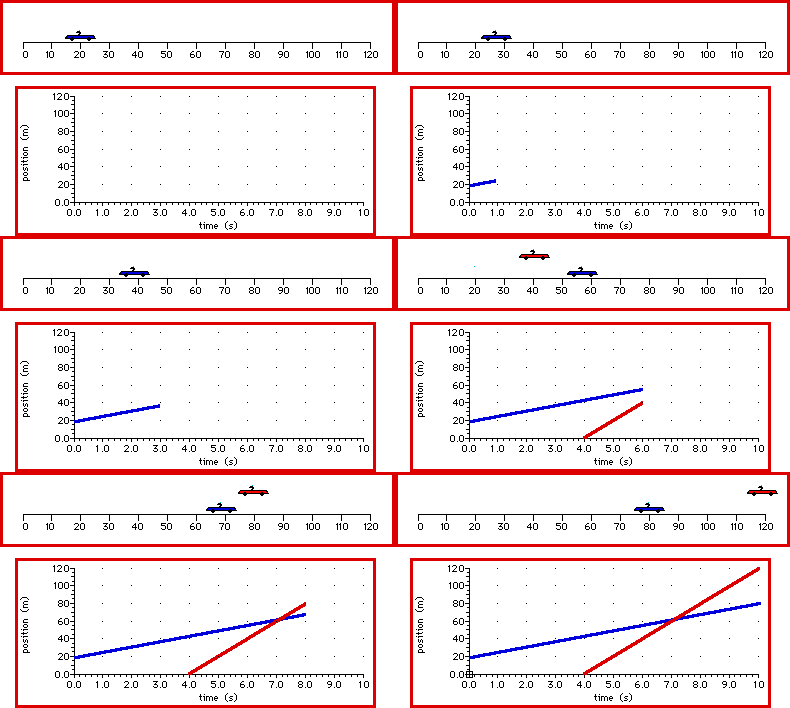
Observe the two cars below. The blue car starts ahead of" the red car. (The red car actually starts off the screen.) Since the red car is moving faster, it eventually catches up with and passes the blue car. Observe the position-time graphs for these two cars. The position-time plot of each car's motion is depicted by a diagonal line with a constant slope. This diagonal line is an indicator of a constant velocity. At the time that the cars are side by side, the lines intersect. That is, the two cars share the same position at that instant in time. The lines would not intersect for a velocity vs. time graph; there is never an instant in time in which they share the same velocity. The two cars have the same position at seven seconds; yet they never have the same velocity at any instant in time.

For more information on physical descriptions of motion, visit The Physics Classroom Tutorial. Detailed information is available there on the following topics:
Ticker Tape Diagrams
Position-Time Graphs