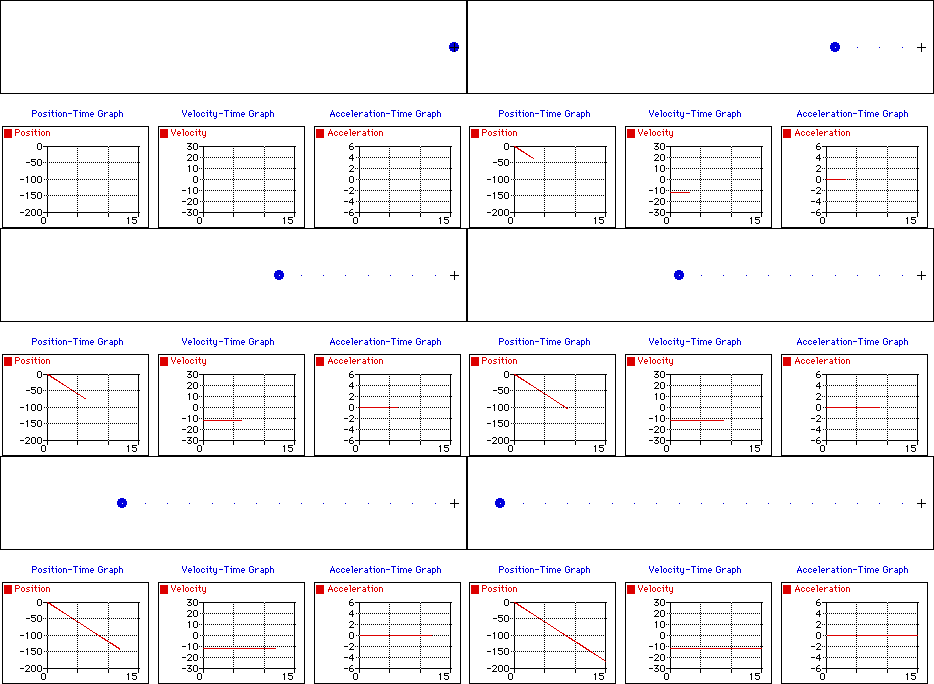
Constant Negative Velocity
Observe that the object below moves with a constant velocity in the negative direction. The dot diagram shows that each consecutive dot is the same distance apart (i.e., a constant velocity). The position-time graph shows that the slope is both constant (meaning a constant velocity) and negative (meaning a negative velocity). The velocity-time graph shows a horizontal line with zero slope (meaning that there is zero acceleration); the line is located in the negative region of the graph (corresponding to a negative velocity). The acceleration-time graph shows a horizontal line at the zero mark (meaning zero acceleration).

For more information on physical descriptions of motion, visit The Physics Classroom Tutorial. Detailed information is available there on the following topics:
Ticker Tape Diagrams
Position-Time Graphs
Velocity-Time Graphs