Hold down the T key for 3 seconds to activate the audio accessibility mode, at which point you can click the K key to pause and resume audio. Useful for the Check Your Understanding and See Answers.
 Our study of 1-dimensional kinematics has been concerned with the multiple means by which the motion of objects can be represented. Such means include the use of words, the use of diagrams, the use of numbers, the use of equations, and the use of graphs. Lesson 3 focuses on the use of position vs. time graphs to describe motion. As we will learn, the specific features of the motion of objects are demonstrated by the shape and the slope of the lines on a position vs. time graph. The first part of this lesson involves a study of the relationship between the shape of a p-t graph and the motion of the object.
Contrasting a Constant and a Changing Velocity
To begin, consider a car moving with a constant, rightward (+) velocity - say of +10 m/s.
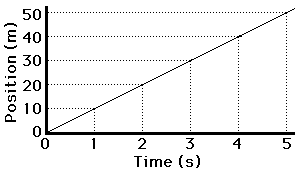 If the position-time data for such a car were graphed, then the resulting graph would look like the graph at the right. Note that a motion described as a constant, positive velocity results in a line of constant and positive slope when plotted as a position-time graph.
Now consider a car moving with a rightward (+), changing velocity - that is, a car that is moving rightward but speeding up or accelerating.
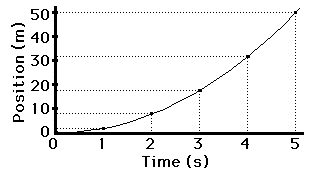 If the position-time data for such a car were graphed, then the resulting graph would look like the graph at the right. Note that a motion described as a changing, positive velocity results in a line of changing and positive slope when plotted as a position-time graph.
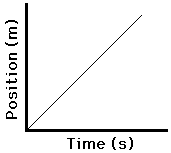
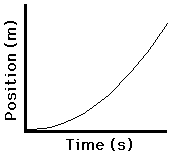
The position vs. time graphs for the two types of motion - constant velocity and changing velocity (acceleration) - are depicted as follows.
Constant Velocity
Positive Velocity |
Positive Velocity
Changing Velocity (acceleration) |
 |
 |
The Importance of Slope
 The shapes of the position versus time graphs for these two basic types of motion - constant velocity motion and accelerated motion (i.e., changing velocity) - reveal an important principle. The principle is that the slope of the line on a position-time graph reveals useful information about the velocity of the object. It is often said, "As the slope goes, so goes the velocity." Whatever characteristics the velocity has, the slope will exhibit the same (and vice versa). If the velocity is constant, then the slope is constant (i.e., a straight line). If the velocity is changing, then the slope is changing (i.e., a curved line). If the velocity is positive, then the slope is positive (i.e., moving upwards and to the right). This very principle can be extended to any motion conceivable.
Contrasting a Slow and a Fast Motion
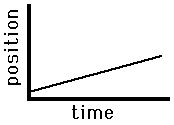
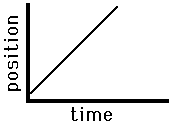
 Consider the graphs below as example applications of this principle concerning the slope of the line on a position versus time graph. The graph on the left is representative of an object that is moving with a positive velocity (as denoted by the positive slope), a constant velocity (as denoted by the constant slope) and a small velocity (as denoted by the small slope). The graph on the right has similar features - there is a constant, positive velocity (as denoted by the constant, positive slope). However, the slope of the graph on the right is larger than that on the left. This larger slope is indicative of a larger velocity. The object represented by the graph on the right is traveling faster than the object represented by the graph on the left. The principle of slope can be used to extract relevant motion characteristics from a position vs. time graph. As the slope goes, so goes the velocity.
Slow, Rightward(+)
Constant Velocity |
Fast, Rightward(+)
Constant Velocity |
 |
 |
 Consider the graphs below as another application of this principle of slope. The graph on the left is representative of an object that is moving with a negative velocity (as denoted by the negative slope), a constant velocity (as denoted by the constant slope) and a small velocity (as denoted by the small slope). The graph on the right has similar features - there is a constant, negative velocity (as denoted by the constant, negative slope). However, the slope of the graph on the right is larger than that on the left. Once more, this larger slope is indicative of a larger velocity. The object represented by the graph on the right is traveling faster than the object represented by the graph on the left.
Slow, Leftward(-)
Constant Velocity |
Fast, Leftward(-)
Constant Velocity |
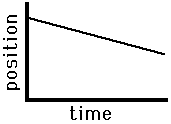 |
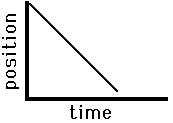 |
Representing an Accelerated Motion
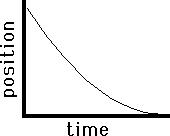
 As a final application of this principle of slope, consider the two graphs below. Both graphs show plotted points forming a curved line. Curved lines have changing slope; they may start with a very small slope and begin curving sharply (either upwards or downwards) towards a large slope. In either case, the curved line of changing slope is a sign of accelerated motion (i.e., changing velocity). Applying the principle of slope to the graph on the left, one would conclude that the object depicted by the graph is moving with a negative velocity (since the slope is negative ). Furthermore, the object is starting with a small velocity (the slope starts out with a small slope) and finishes with a large velocity (the slope becomes large). That would mean that this object is moving in the negative direction and speeding up (the small velocity turns into a larger velocity). This is an example of negative acceleration - moving in the negative direction and speeding up. The graph on the right also depicts an object with negative velocity (since there is a negative slope). The object begins with a high velocity (the slope is initially large) and finishes with a small velocity (since the slope becomes smaller). So this object is moving in the negative direction and slowing down. This is an example of positive acceleration.
Negative (-) Velocity
Slow to Fast |
Leftward (-) Velocity
Fast to Slow |
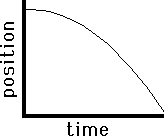 |
 |
The principle of slope is an incredibly useful principle for extracting relevant information about the motion of objects as described by their position vs. time graph. Once you've practiced the principle a few times, it becomes a very natural means of analyzing position-time graphs.
Investigate!
The widget below plots the position-time plot for an object with specified characteristics. The top widget plots the motion for an object moving with a constant velocity. The bottom widget plots the motion for an accelerating object. Simply enter the specified values and the widget then plots the line with position on the vertical axis and time on the horizontal axis. Be sure to observe the difference between the constant velocity plot and the accelerated motion plot.
We Would Like to Suggest ...
 Sometimes it isn't enough to just read about it. You have to interact with it! And that's exactly what you do when you use one of The Physics Classroom's Interactives. We would like to suggest that you combine the reading of this page with the use of our Graph That Motion or our Graphs and Ramps Interactives. Each is found in the Physics Interactives section of our website and allows a learner to apply concepts of kinematic graphs (both position-time and velocity-time) to describe the motion of objects.
Check Your Understanding
Use the principle of slope to describe the motion of the objects depicted by the two plots below. In your description, be sure to include such information as the direction of the velocity vector (i.e., positive or negative), whether there is a constant velocity or an acceleration, and whether the object is moving slow, fast, from slow to fast or from fast to slow. Be complete in your description.